Estimating Battery Degradation

Volkswagen e-Golf Forum

Help Support Volkswagen e-Golf Forum:

This site may earn a commission from merchant affiliate links, including eBay, Amazon, and others.
I've had my '15 SEL Premium here in Scottsdale AZ since June of this year. I bought it used and had it shipped from California.

It's my daily commuter, and so far I've put about 6k miles over the last 5 months. With the Summer heat we have here, and plans to drive this car into the ground, I hope I get to be one of the first to file a warranty claim for battery degradation!

Haven't seen any issues so far, other than in August and September it was still too hot in my garage for my charger and it would drop down to 12A from 24. I'm going to consider active cooling solutions before it starts to get hot again.
 
My 2015 SEL has about 13000 miles. I just took it to 33% SOC: 68 miles, 5.0 miles/kWh=20.3kWh battery capacity.
 
Just ran my numbers and came to 20.0 kWh of usable battery on my 2016 SEL with 1200 miles.

66 miles at 4.4 mi/kWh = 15 kWh used
25% remaining charge (per carnet) = 20.0kWh usable battery.
 
Spektre said:
I've had my '15 SEL Premium here in Scottsdale AZ since June of this year. I bought it used and had it shipped from California.

It's my daily commuter, and so far I've put about 6k miles over the last 5 months. With the Summer heat we have here, and plans to drive this car into the ground, I hope I get to be one of the first to file a warranty claim for battery degradation!

Haven't seen any issues so far, other than in August and September it was still too hot in my garage for my charger and it would drop down to 12A from 24. I'm going to consider active cooling solutions before it starts to get hot again.
Out here in the desert, too. Now that summer is over the range has popped right back up to where it's always been just in time for the near freezing temps to knock it back down! Ah, the joys of desert living :)

After this first summer with the eGolf I feel like the A/C hits the battery harder than the outside temperature (in terms of direct impact).
 
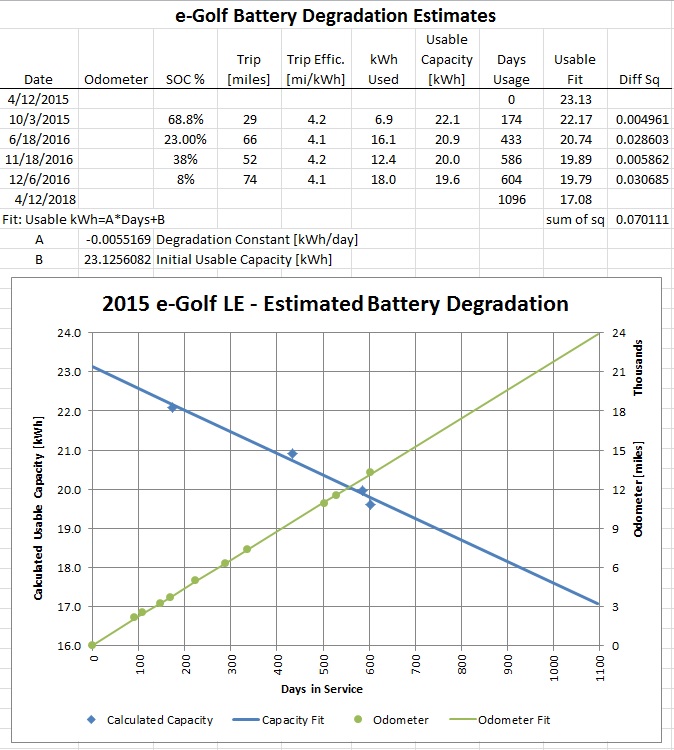
Well, I am sad to report that the degradation seems real. It turns out that I made a mistake in the first post of this thread and the Usable Capacity did not go UP by 846Wh as I said, but it had already gone down by that amount. I had simply flipped the age of the data in my mind when I wrote the comment.

I started out by pulling my previous data out of this thread and throwing it into a spreadsheet, without thinking about any trend. I did not simultaneously record the odometer value with the trip and efficiency data, but I did record it in another location at different times. Otherwise, I would have plotted directly against mileage instead of time. So, here is the result. I don't think there's any doubt that there is a trend.

e_Golf_Degradation_2016.jpg


The end of the chart is the projection to the end of our lease. I make no representation to the validity of this data or my calculations and I make no claim that my car or your car will follow this trend line.
 
I am at 425 days of usage, effective 12-6-2016, today, Exactly 14 months of usage, and I am indicating 19.7 to 19.95 kwh of useable charge left in my battery. I have just a bit over 8300 miles on my 2015 SEL e-Golf. It's my belief that the degradation is quite real, as my route is consistent to and from my father's home, 13.5 miles away, as is my driving pattern, and lack of use of any accessories that are power users, such as heater or AC, or heated seats, it's quite temperate here in So CA. I noticed the most amount of loss from May of 2016 through October of 2016. It has since stabilized or slowed down since cooler weather has arrived. I will have no hesitation to get my battery replaced under warranty, if required. It seems to be losing 10% useable every 14 months. My Guess O Meter range has declined from 129 mile on a full charge, to 116 miles on a full charge, as of today.
 
I don't know how to insert a graph, but I have included the data below. It's only about six months, and about 4000 miles.Maybe I need to collect more data to view any degradation, but since I started tracking the data, there is no trend - the line is flat.

Date, kWh used, SOC, estimated battery capacity

7/1/16 0:00:00 15.8 19% 19.5
7/13/16 0:00:00 16.0
7/16/16 0:00:00 11.8
7/21/16 0:00:00 14.1 28% 19.5
7/24/16 0:00:00 17.8 9% 19.6
7/27/16 0:00:00 13.0 36% 20.4
8/4/16 0:00:00 17.8
Aug 9, 2016 14.0 34% 21.3
8/13/16 0:00:00 11.8
8/19/16 0:00:00 14.0 30% 19.9
8/25/16 0:00:00 14.7 26% 19.9
8/29/16 0:00:00 13.9 35% 21.3
9/1/16 0:00:00 11.2 44% 20.0
9/10/16 0:00:00 15.5 22% 19.9
9/14/16 0:00:00 18.3
9/19/16 0:00:00 15.6 19% 19.3
9/21/16 0:00:00 15.3
9/26/16 0:00:00 9.1
9/30/16 0:00:00 14.3
10/4/16 0:00:00 15.1
10/7/16 0:00:00 12.3 40% 20.5
10/13/16 0:00:00 10.1
10/13/16 0:00:00 11.8
10/16/16 0:00:00 15.3
10/19/16 0:00:00 13.8
10/23/16 0:00:00 13.9
10/28/16 0:00:00 11.8
11/2/16 0:00:00 15.5
11/5/16 0:00:00 15.6 20% 19.5
11/9/16 0:00:00 15.2
11/13/16 0:00:00 13.5
11/15/16 0:00:00 13.1
11/18/16 0:00:00 14.4
11/21/16 0:00:00 13.6 33% 20.3
 
Battery degradation is not a linear slope. I *think* these batteries lose capacity relatively consistently to around the 80% mark. It should level out somewhere around the time I suspect the warranty would otherwise kick in, which has always been my suspicion of how they calculated the warranty duration.

It's not necessarily a bad thing (not in the sense like they're doing anything tricky), but just recognize that unless something is defective or something occurs that VW didn't account for (those of us in really freezing weather or extremely hot climates) the degradation will probably ease up right around an acceptable capacity level.
 
miimura said:
Well, I am sad to report that the degradation seems real. It turns out that I made a mistake in the first post of this thread and the Usable Capacity did not go UP by 846Wh as I said, but it had already gone down by that amount. I had simply flipped the age of the data in my mind when I wrote the comment.

I started out by pulling my previous data out of this thread and throwing it into a spreadsheet, without thinking about any trend. I did not simultaneously record the odometer value with the trip and efficiency data, but I did record it in another location at different times. Otherwise, I would have plotted directly against mileage instead of time. So, here is the result. I don't think there's any doubt that there is a trend.

e-Golf%20Degradation%202016_zpsx6hmjiva.jpg


The end of the chart is the projection to the end of our lease. I make no representation to the validity of this data or my calculations and I make no claim that my car or your car will follow this trend line.

An approximate 700,800, 900 and 1,000 days in service might not be a bad idea to mark on the calendar, if it's not too much trouble, to check trend analysis.

Sat March 11th, 2017 700

July 20th, 2017 800
 
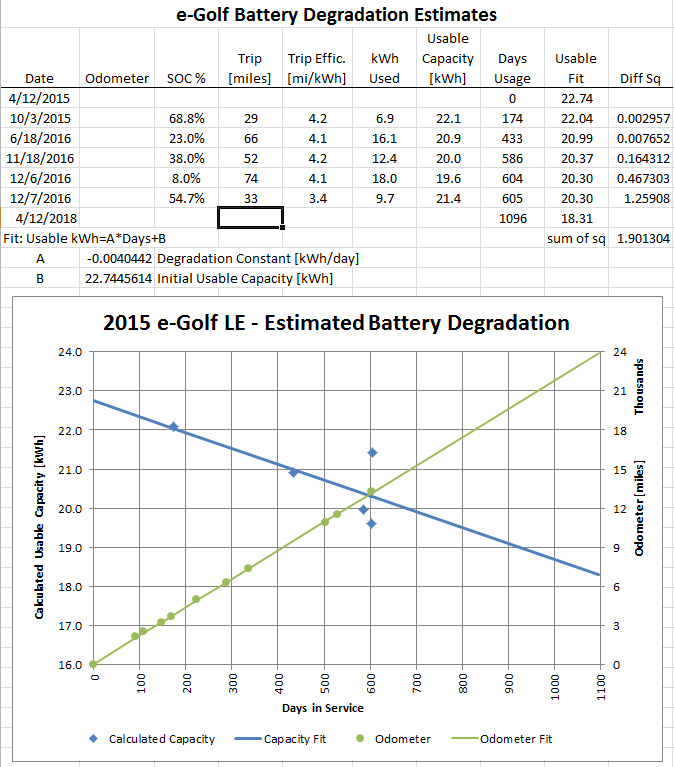
So, it looks like it's not as bad as the prior chart made it look. I calculated another data point yesterday and calculated usable capacity is 9% higher than the previous day. See this new chart:

Battery_Degradataion_20161207.jpg


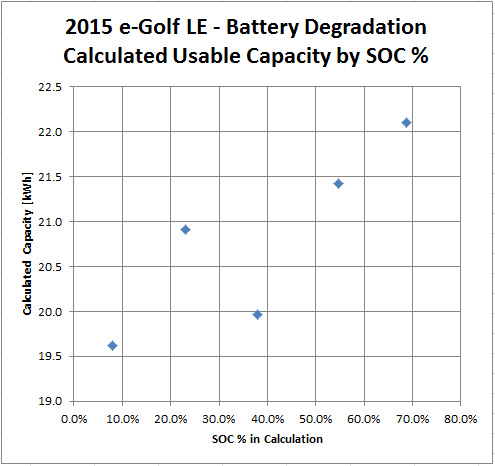
Also, somebody suggested the the usable capacity calculation seemed to vary by how much of the battery had been used. So, I made a scatter plot of the calculated capacity by SOC % remaining.

Battery_Degradataion_20161207_by_SOC.jpg


So, it looks like there is a definite correlation there. Anyway, I will take data more often so I have a better cloud of data and we will have a better correlation to the actual capacity over time. I think the small number of data points led to an improper conclusion about the trend. However, it's still worrying to me that when you use almost all of the battery, the indicated total is less.
 
If you are getting 4 miles /kwh on average, take it down to 4 miles left, as an experiment, and see what it indicates left % on your phone, and what it all calculates out to for capacity.
 
JoulesThief said:
An approximate 700,800, 900 and 1,000 days in service might not be a bad idea to mark on the calendar, if it's not too much trouble, to check trend analysis.

Sat March 11th, 2017 700

July 20th, 2017 800
I will probably try to take data about once a week and at as many different battery levels as possible so that there is more data to judge by. There is a lot of uncertainty in these calculations, so having a good point cloud should help to bring out the real trend.

JoulesThief said:
If you are getting 4 miles /kwh on average, take it down to 4 miles left, as an experiment, and see what it indicates left % on your phone, and what it all calculates out to for capacity.
Getting the car down to very low SOC actually takes some effort. We only got down to 8% because I forgot to plug the car in after my wife had an unusually busy day driving around. I took the car the next day and found a place to charge it at lunchtime, just enough for the rest of my day of driving. Just before that charge was the 8% remaining, so it represented two days of driving. I would expect that a longer period of use between charges would introduce more uncertainty in the calculation.
 
Why did the initial usable capacity change from one chart to the next? Did I miss the explanation?
 
miimura said:
So, it looks like it's not as bad as the prior chart made it look. I calculated another data point yesterday and calculated usable capacity is 9% higher than the previous day. See this new chart:

Battery%20Degradataion%2020161207_zpsqgp9ldwi.jpg


Also, somebody suggested the the usable capacity calculation seemed to vary by how much of the battery had been used. So, I made a scatter plot of the calculated capacity by SOC % remaining.

Battery%20Degradataion%2020161207%20by%20SOC_zpsx6eqvfei.jpg


So, it looks like there is a definite correlation there. Anyway, I will take data more often so I have a better cloud of data and we will have a better correlation to the actual capacity over time. I think the small number of data points led to an improper conclusion about the trend. However, it's still worrying to me that when you use almost all of the battery, the indicated total is less.

I'm confused by the bolded section. I read the second graph to say the opposite - the larger percentage of the battery that you use, the greater the indicated total capacity. This seems like a good idea to me, that is, to be conservative with the estimated remaining charge.

Am I missing something / reading this wrong?
 
GetOffYourGas said:
miimura said:
Also, somebody suggested the the usable capacity calculation seemed to vary by how much of the battery had been used. So, I made a scatter plot of the calculated capacity by SOC % remaining.

Battery_Degradataion_20161207_by_SOC.jpg
]

So, it looks like there is a definite correlation there. Anyway, I will take data more often so I have a better cloud of data and we will have a better correlation to the actual capacity over time. I think the small number of data points led to an improper conclusion about the trend. However, it's still worrying to me that when you use almost all of the battery, the indicated total is less.

I'm confused by the bolded section. I read the second graph to say the opposite - the larger percentage of the battery that you use, the greater the indicated total capacity. This seems like a good idea to me, that is, to be conservative with the estimated remaining charge.

Am I missing something / reading this wrong?
The chart shown above shows the SOC remaining in the car which is used to calculate the total capacity. So, the more you have remaining, the larger the calculated total is. However, there may also be a time component, since the highest SOC value is the oldest (when the car was newest). This is why I want to collect more data from this same car so that I can separate the time effect from the SOC effect on the calculation.
 
miimura said:
GetOffYourGas said:
miimura said:
Also, somebody suggested the the usable capacity calculation seemed to vary by how much of the battery had been used. So, I made a scatter plot of the calculated capacity by SOC % remaining.

Battery%20Degradataion%2020161207%20by%20SOC_zpsx6eqvfei.jpg


So, it looks like there is a definite correlation there. Anyway, I will take data more often so I have a better cloud of data and we will have a better correlation to the actual capacity over time. I think the small number of data points led to an improper conclusion about the trend. However, it's still worrying to me that when you use almost all of the battery, the indicated total is less.

I'm confused by the bolded section. I read the second graph to say the opposite - the larger percentage of the battery that you use, the greater the indicated total capacity. This seems like a good idea to me, that is, to be conservative with the estimated remaining charge.

Am I missing something / reading this wrong?
The chart shown above shows the SOC remaining in the car which is used to calculate the total capacity. So, the more you have remaining, the larger the calculated total is. However, there may also be a time component, since the highest SOC value is the oldest (when the car was newest). This is why I want to collect more data from this same car so that I can separate the time effect from the SOC effect on the calculation.
Taking off driving on a hot, just freshly fully charged battery, in my estimation will add a few miles of range.
 
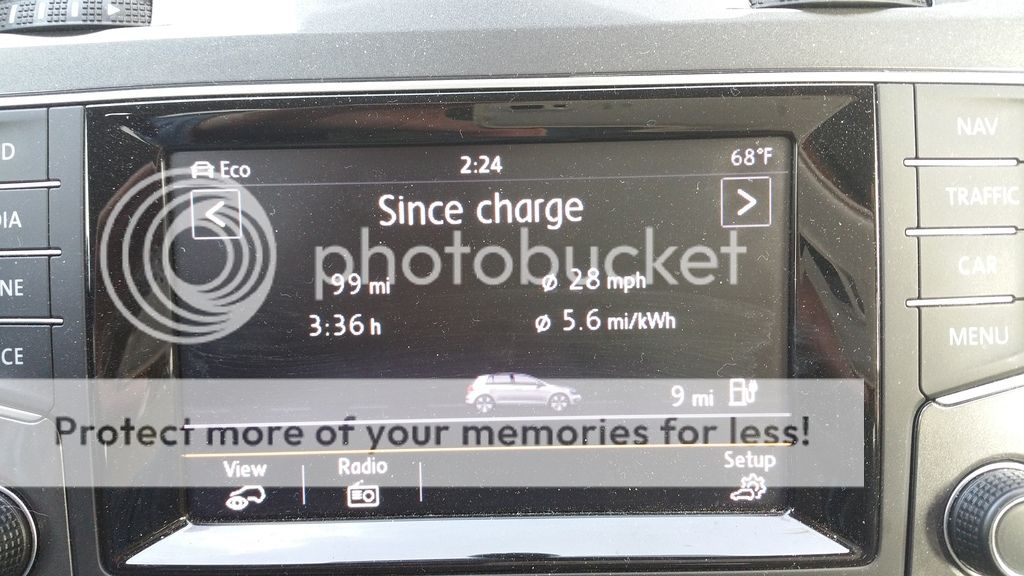
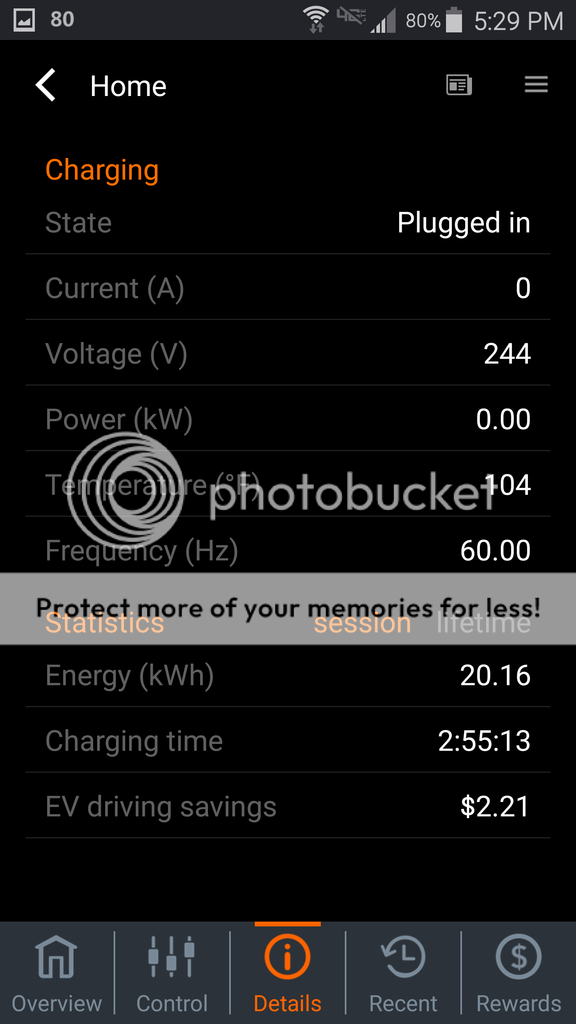
Today's recharge.

9% SOC
99 miles
5.6mi/kwh
20.16kwh taken out of my e-motorwerks Juicenet Pro 40, the battery probably only gets 90 to 91% of that actually into recharging the battery.
121 miles estimated range this time once fully charged.

99/5.6 = 17.679 kwh @ 91% = 19.427 kwh remaining battery capacity. :-(

://img.photobucket.com/albums/v374/grand_toots/2015%20E-Golf/20161211_142359_zpslfmsf4zm.jpg

20161211_142405_zpsxb3n5qqu.jpg


Screenshot_2016-12-11-14-41-47_zpsv6oaeeoq.png


Screenshot_2016-12-11-17-29-13_zpscykcqw6z.png


Screenshot_2016-12-11-17-41-25_zpsb8ytywsx.png
 
We have almost 27K miles on our '15 SEL, and we have no discernible capacity loss. None.

And the largest charge is about 22kWh. I don't know where any of these other number are coming from. You cannot guess about wall-to-wheel losses.
 
miimura said:
The chart shown above shows the SOC remaining in the car which is used to calculate the total capacity. So, the more you have remaining, the larger the calculated total is. However, there may also be a time component, since the highest SOC value is the oldest (when the car was newest). This is why I want to collect more data from this same car so that I can separate the time effect from the SOC effect on the calculation.

Ok, thanks. I was just reading it wrong. I thought by "% SoC" you meant the percent used in your calculation, not the percent remaining. My bad.
 
Is anyone else still checking their battery degradation besides mimura? With warm ups into the mid 70's to low 80's, my guess o meter has bumped up into 123 to 124 miles of range on a full recharge. 10,300 on the odometer currently, 18 months of ownership April 6th.
 
Back
Top